
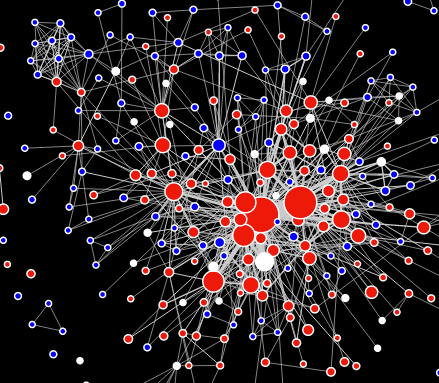
 The MaRS Data Catalyst team has been diving into data on private equity deals, to better understand the patterns of investments in Canadian companies. Last week Joseph Lalonde published the first in a series of blog posts on the subject: Co-investment in the Canadian venture capital landscape. The post features a network graph which they asked me to create, to visualize the data (direct link).
I made the graph using d3.js. I’ve been working with d3 for a while now, but each new project has been unique… it’s an amazingly flexible library.
Collaborating with Joseph and the Data Catalyst team was a blast; a great group of people doing super-interesting work!