
Check out the cool stuff we made at the Toronto budget mini-hackathon this weekend!
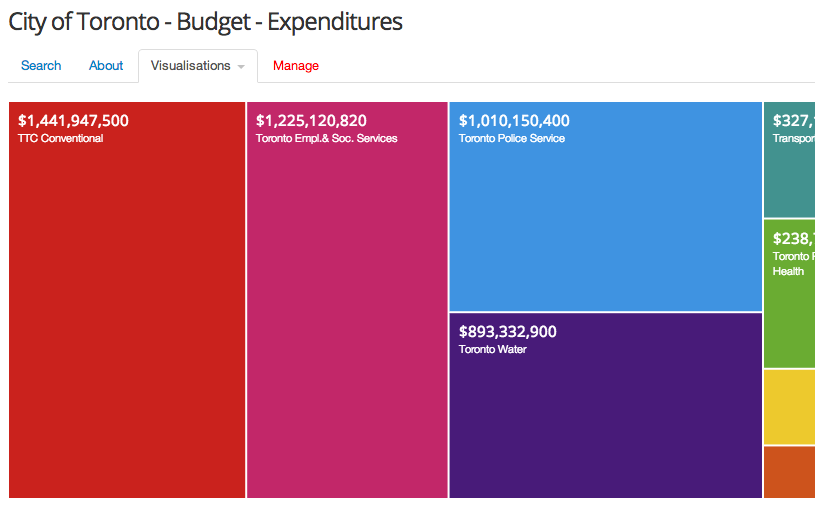
We parsed the 2012 city budget from a messy bunch of Excel files, and uploaded it to OpenSpending — which produces this interactive treemap:
We also got the data into Tableau, and produced this less colourful but more readable treemap: 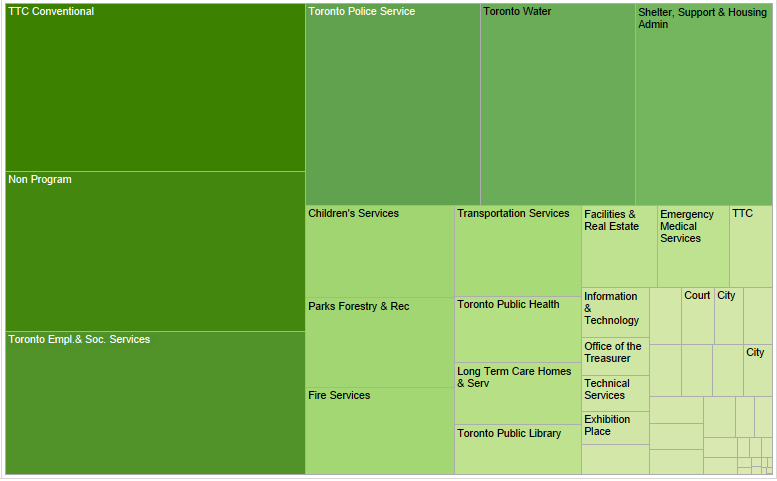
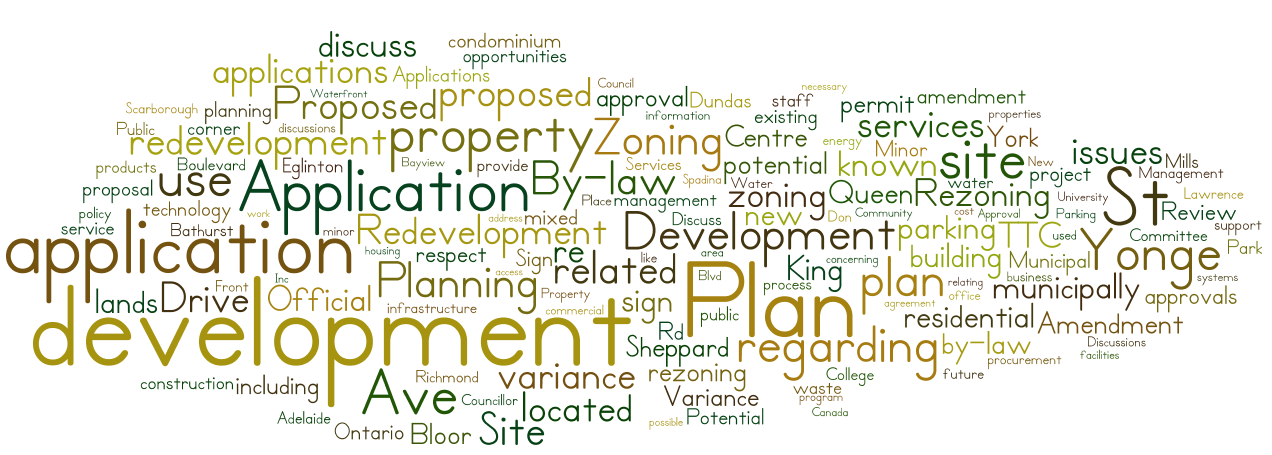
We slogged through an XML snapshot from the city’s Lobbyist Registry data, filtered out everything except the “particulars” of lobbyist activities at the City of Toronto (basically, descriptions about what they’re meeting about). It’s an ideal dataset for a tag cloud:
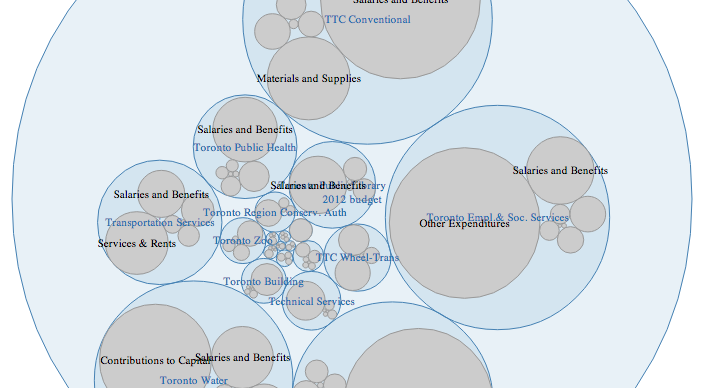
We also took that operating budget data, and built a zoomable pack layout visualization with it, using d3.js. (The interactive version needs a little more work, so in the meantime here’s a screenshot.)
What we did, in more detail:
- I wrote a parser in PHP which (somewhat) automates the process of getting the budget data into a machine-readable format. (I’ll publish that soon.)
- Andrew, Alex and David did some analysis of the 10-year capital budget data.
- Alex got the expenditures data into Tableau, and made a treemap and a couple of other visualizations with it.
- Andrew and Alex did some analysis of the lobbyist registry data (which is available only as an immense XML file).
- Andrew filtered out the ‘particulars’ from the lobbyist registry data, and made a word cloud with it.
- All of us got to know the City of Toronto’s Open Data portal and datasets a lot better.
- Alex and David filled us in on Better Budget Day (coming in October), and the (underwhelming) changes that the City is making to the 2014 budget process, passed last week.
- I posted expenditure data to OpenSpending (here).
- I got expenditures data into a d3.js zoomable pack layout visualization (though I need to polish it a bit more before I publish it).
- I also tried getting expenditures data into a d3.js stacked barchart viz, but that ended up looking awful. (Oops.)
Thanks to Andrew, Alex, Alex and David for participating! Thanks also to Anders from OpenSpending, for organizing the global event! We’re floating the idea of getting together again in a few weeks, so if anyone else is interested in joining us, get in touch (gabe@pwd.ca).
Well that’s just awesome. Sorry I missed it!
Pingback: Better Budget » Toronto Budget Mini-Hackathon
Alex Mansourati blogged about the event too: http://amansourati.wordpress.com/2013/07/30/toronto-budget-mini-hackathon/
Love the visualizations. How can one find out more about what an allocation actually covers? Specifically I’m curious as to what “Transportation Services” is, as it’s listed separately from the TTC…
Thanks, Derek! Here’s the website for the City’s Transportation Services division (it’ll give you a sense of what they’re responsible for): http://www.toronto.ca/transportation/
For those who are interested, here’s the (PHP) parser I built to turn those ugly Excel files into (hopefully complete) CSVs: https://github.com/gabesawhney/toronto-budget-parser/blob/master/parser.php
Looks awesome! I’d love to come to another one of these if you have them again.