
An acquaintance dropped me a line this winter asking if there’s a tool available for getting notifications of City of Toronto council / committee meeting agenda items of interest. Tabs Toronto did this from 2012-2018, but has since been offline. So I promised to see what I could do, and I’ve posted the tool here: http://pwd.ca/tabs/
 Recently read
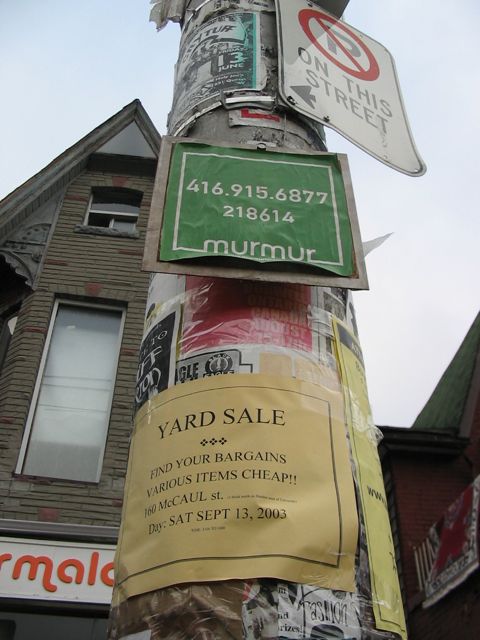
- Parking signs and possible futures for LLMs in government - Ad Hoc
- https://ottawacitizen-com.cdn.ampproject.org/c/s/ottawacitizen.com/opinion/boots-and-clarke-arrivecan-mess-should-drive-deeper-reforms-in-government-contracting/wcm/91ee0c54-0436-4eb2-b7db-7389ea824791/amp/
- Reducing the time tax burdens on Canadians | by Springboard Policy | Medium
- A downtown Toronto laneway home offers loft vibes and incredible skyline views
- From right to buy to housing crisis: how home ownership killed Britain’s property dream | Housing | The Guardian
- It’s Time to End the Battle Between Waterfall and Agile
- https://jobs.toronto.ca/jobsatcity/job/Toronto-MANAGEMENT-CONSULTANT-(Data-Strategy)-ON-M4Y-0E6/573568717/
- How to Make Money Fast: NYC Idling Vehicle Reporters Cash in Big – NBC New York
- The less-than-thrilling reason the Toronto Maple Leafs are not the Maple Leaves - The Washington Post
- Veganism didn’t agree with me. What’s the most ethical alternative? | Food | The Guardian
- Wireless Toronto
- New hotspot: Dawes Crossing (park!) July 9, 2013
- St. Lawrence Market is back online May 24, 2012
- St. Lawrence Market and Dufferin Grove Park are offline March 2, 2012